Visual example of reliability and validity (statistics) in LaTeX
I have been searching for good resources about visualizing reliability and validity in research methodology, but could not find unlicensed or free (as beer and as speech) examples fitting my needs.
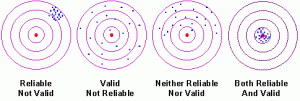
Well, my needs might seem specific, as I do not like the classic example of validity and reliability showed in most basic statistics/research methodology book (like Babbie’s The practice of social research) with the target and shots, as I assume, that thinking in 2 dimensions for starters seems more difficult with these terms. Just for the example see:
I tried with LaTeX and TikZ to build my own graphs which I share here in hope of someone could use these in the future.
First, I was searching for 1D coordinate systems in LaTeX, and came up with the idea to show measurements on a timeline. This could be easily done with chronology found on CTAN:
\begin{chronology}[5]{0}{40}{3ex}{\textwidth} \event{20}{First} \event{18}{Second} \event{19}{Third} \event{22}{Fourth} \event{23}{Fifth} \end{chronology} |
Which results in (as an example of valid and reliable measurements):
That was quite fine but including several chronology parts in my presentation gave back some error messages which I could not eliminate, so I moved on for “better” solutions.
I was checking the examples of Tikz and PSTricks, but could not find a complete solution. So I started in the beginning with creating one axis, having it labelled and put on some markers:
\begin{tikzpicture}[xscale=0.1,yscale=0.1] \draw[snake] (-10,0) -- (0,0); \draw (0,0) -- (100,0); \draw[snake] (100,0) -- (110,0); \draw[arrows=->](110,0)--(111,0); \foreach \x in {0,10,20,30,40,50,60,70,80,90,100} \draw (\x cm,30pt) -- (\x cm,-30pt); \draw (0,0) node[below=3pt] {$ 0 $}; \draw (10,0) node[below=3pt] {$ 10 $}; \draw (20,0) node[below=3pt] {$ 20 $}; \draw (30,0) node[below=3pt] {$ 30 $}; \draw (40,0) node[below=3pt] {$ 40 $}; \draw (50,0) node[below=3pt] {$ 50 $}; \draw (60,0) node[below=3pt] {$ 60 $}; \draw (70,0) node[below=3pt] {$ 70 $}; \draw (80,0) node[below=3pt] {$ 80 $}; \draw (90,0) node[below=3pt] {$ 90 $}; \draw (100,0) node[below=3pt] {$ 100 $}; \draw (111,0) node[below=3pt] {$ ^\circ C $}; \foreach \x in {5,16,28,51,33} \shade[ball color=red] (\x,0) circle(40pt); \end{tikzpicture} |
And the result (of a not reliable and not valid measurement set):
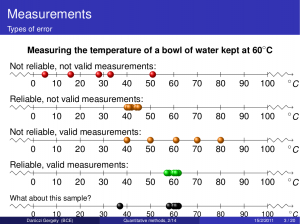
I really like this example, as showing all the possible values of the temperature of water (below 0 Celsius degree it is considered as ice, above 100 Celsius degree, it is considered as steam), so validity and reliability can be judged easily. The source code of my slide and the result can be seen above, feel free to (re)use it! (Note: the scale parameter was given in the header of tikzpicture to fit in the slide, because I was lazy to rewrite the code from centimeters. Sorry for that!)
\begin{frame} \frametitle{Reliability and validity} \framesubtitle{A visual example} \begin{center} \textbf{Measuring the temperature of a bowl of water kept at 60$^\circ$C} \end{center} Not reliable, not valid measurements: \begin{tikzpicture}[xscale=0.1,yscale=0.1] \draw[snake] (-10,0) -- (0,0); \draw (0,0) -- (100,0); \draw[snake] (100,0) -- (110,0); \draw[arrows=->](110,0)--(111,0); \foreach \x in {0,10,20,30,40,50,60,70,80,90,100} \draw (\x cm,30pt) -- (\x cm,-30pt); \draw (0,0) node[below=3pt] {$ 0 $}; \draw (10,0) node[below=3pt] {$ 10 $}; \draw (20,0) node[below=3pt] {$ 20 $}; \draw (30,0) node[below=3pt] {$ 30 $}; \draw (40,0) node[below=3pt] {$ 40 $}; \draw (50,0) node[below=3pt] {$ 50 $}; \draw (60,0) node[below=3pt] {$ 60 $}; \draw (70,0) node[below=3pt] {$ 70 $}; \draw (80,0) node[below=3pt] {$ 80 $}; \draw (90,0) node[below=3pt] {$ 90 $}; \draw (100,0) node[below=3pt] {$ 100 $}; \draw (111,0) node[below=3pt] {$ ^\circ C $}; \foreach \x in {5,16,28,51,33} \shade[ball color=red] (\x,0) circle(40pt); \end{tikzpicture} Reliable, not valid measurements: \begin{tikzpicture}[xscale=0.1,yscale=0.1] \draw[snake] (-10,0) -- (0,0); \draw (0,0) -- (100,0); \draw[snake] (100,0) -- (110,0); \draw[arrows=->](110,0)--(111,0); \foreach \x in {0,10,20,30,40,50,60,70,80,90,100} \draw (\x cm,30pt) -- (\x cm,-30pt); \draw (0,0) node[below=3pt] {$ 0 $}; \draw (10,0) node[below=3pt] {$ 10 $}; \draw (20,0) node[below=3pt] {$ 20 $}; \draw (30,0) node[below=3pt] {$ 30 $}; \draw (40,0) node[below=3pt] {$ 40 $}; \draw (50,0) node[below=3pt] {$ 50 $}; \draw (60,0) node[below=3pt] {$ 60 $}; \draw (70,0) node[below=3pt] {$ 70 $}; \draw (80,0) node[below=3pt] {$ 80 $}; \draw (90,0) node[below=3pt] {$ 90 $}; \draw (100,0) node[below=3pt] {$ 100 $}; \draw (111,0) node[below=3pt] {$ ^\circ C $}; \foreach \x in {40,42,44,45,41} \shade[ball color=orange] (\x,0) circle(40pt); \end{tikzpicture} Not reliable, valid measurements: \begin{tikzpicture}[xscale=0.1,yscale=0.1] \draw[snake] (-10,0) -- (0,0); \draw (0,0) -- (100,0); \draw[snake] (100,0) -- (110,0); \draw[arrows=->](110,0)--(111,0); \foreach \x in {0,10,20,30,40,50,60,70,80,90,100} \draw (\x cm,30pt) -- (\x cm,-30pt); \draw (0,0) node[below=3pt] {$ 0 $}; \draw (10,0) node[below=3pt] {$ 10 $}; \draw (20,0) node[below=3pt] {$ 20 $}; \draw (30,0) node[below=3pt] {$ 30 $}; \draw (40,0) node[below=3pt] {$ 40 $}; \draw (50,0) node[below=3pt] {$ 50 $}; \draw (60,0) node[below=3pt] {$ 60 $}; \draw (70,0) node[below=3pt] {$ 70 $}; \draw (80,0) node[below=3pt] {$ 80 $}; \draw (90,0) node[below=3pt] {$ 90 $}; \draw (100,0) node[below=3pt] {$ 100 $}; \draw (111,0) node[below=3pt] {$ ^\circ C $}; \foreach \x in {40,80,50,70,61} \shade[ball color=orange] (\x,0) circle(40pt); \end{tikzpicture} Reliable, valid measurements: \begin{tikzpicture}[xscale=0.1,yscale=0.1] \draw[snake] (-10,0) -- (0,0); \draw (0,0) -- (100,0); \draw[snake] (100,0) -- (110,0); \draw[arrows=->](110,0)--(111,0); \foreach \x in {0,10,20,30,40,50,60,70,80,90,100} \draw (\x cm,30pt) -- (\x cm,-30pt); \draw (0,0) node[below=3pt] {$ 0 $}; \draw (10,0) node[below=3pt] {$ 10 $}; \draw (20,0) node[below=3pt] {$ 20 $}; \draw (30,0) node[below=3pt] {$ 30 $}; \draw (40,0) node[below=3pt] {$ 40 $}; \draw (50,0) node[below=3pt] {$ 50 $}; \draw (60,0) node[below=3pt] {$ 60 $}; \draw (70,0) node[below=3pt] {$ 70 $}; \draw (80,0) node[below=3pt] {$ 80 $}; \draw (90,0) node[below=3pt] {$ 90 $}; \draw (100,0) node[below=3pt] {$ 100 $}; \draw (111,0) node[below=3pt] {$ ^\circ C $}; \foreach \x in {58,60,62,61,57} \shade[ball color=green] (\x,0) circle(40pt); \end{tikzpicture} \footnotesize What about this sample? \begin{tikzpicture}[xscale=0.1,yscale=0.1] \draw[snake] (-10,0) -- (0,0); \draw (0,0) -- (100,0); \draw[snake] (100,0) -- (110,0); \draw[arrows=->](110,0)--(111,0); \foreach \x in {0,10,20,30,40,50,60,70,80,90,100} \draw (\x cm,30pt) -- (\x cm,-30pt); \draw (0,0) node[below=3pt] {$ 0 $}; \draw (10,0) node[below=3pt] {$ 10 $}; \draw (20,0) node[below=3pt] {$ 20 $}; \draw (30,0) node[below=3pt] {$ 30 $}; \draw (40,0) node[below=3pt] {$ 40 $}; \draw (50,0) node[below=3pt] {$ 50 $}; \draw (60,0) node[below=3pt] {$ 60 $}; \draw (70,0) node[below=3pt] {$ 70 $}; \draw (80,0) node[below=3pt] {$ 80 $}; \draw (90,0) node[below=3pt] {$ 90 $}; \draw (100,0) node[below=3pt] {$ 100 $}; \draw (111,0) node[below=3pt] {$ ^\circ C $}; \foreach \x in {58,60,62,61,37} \shade[ball color=black] (\x,0) circle(40pt); \end{tikzpicture} \end{frame} |


